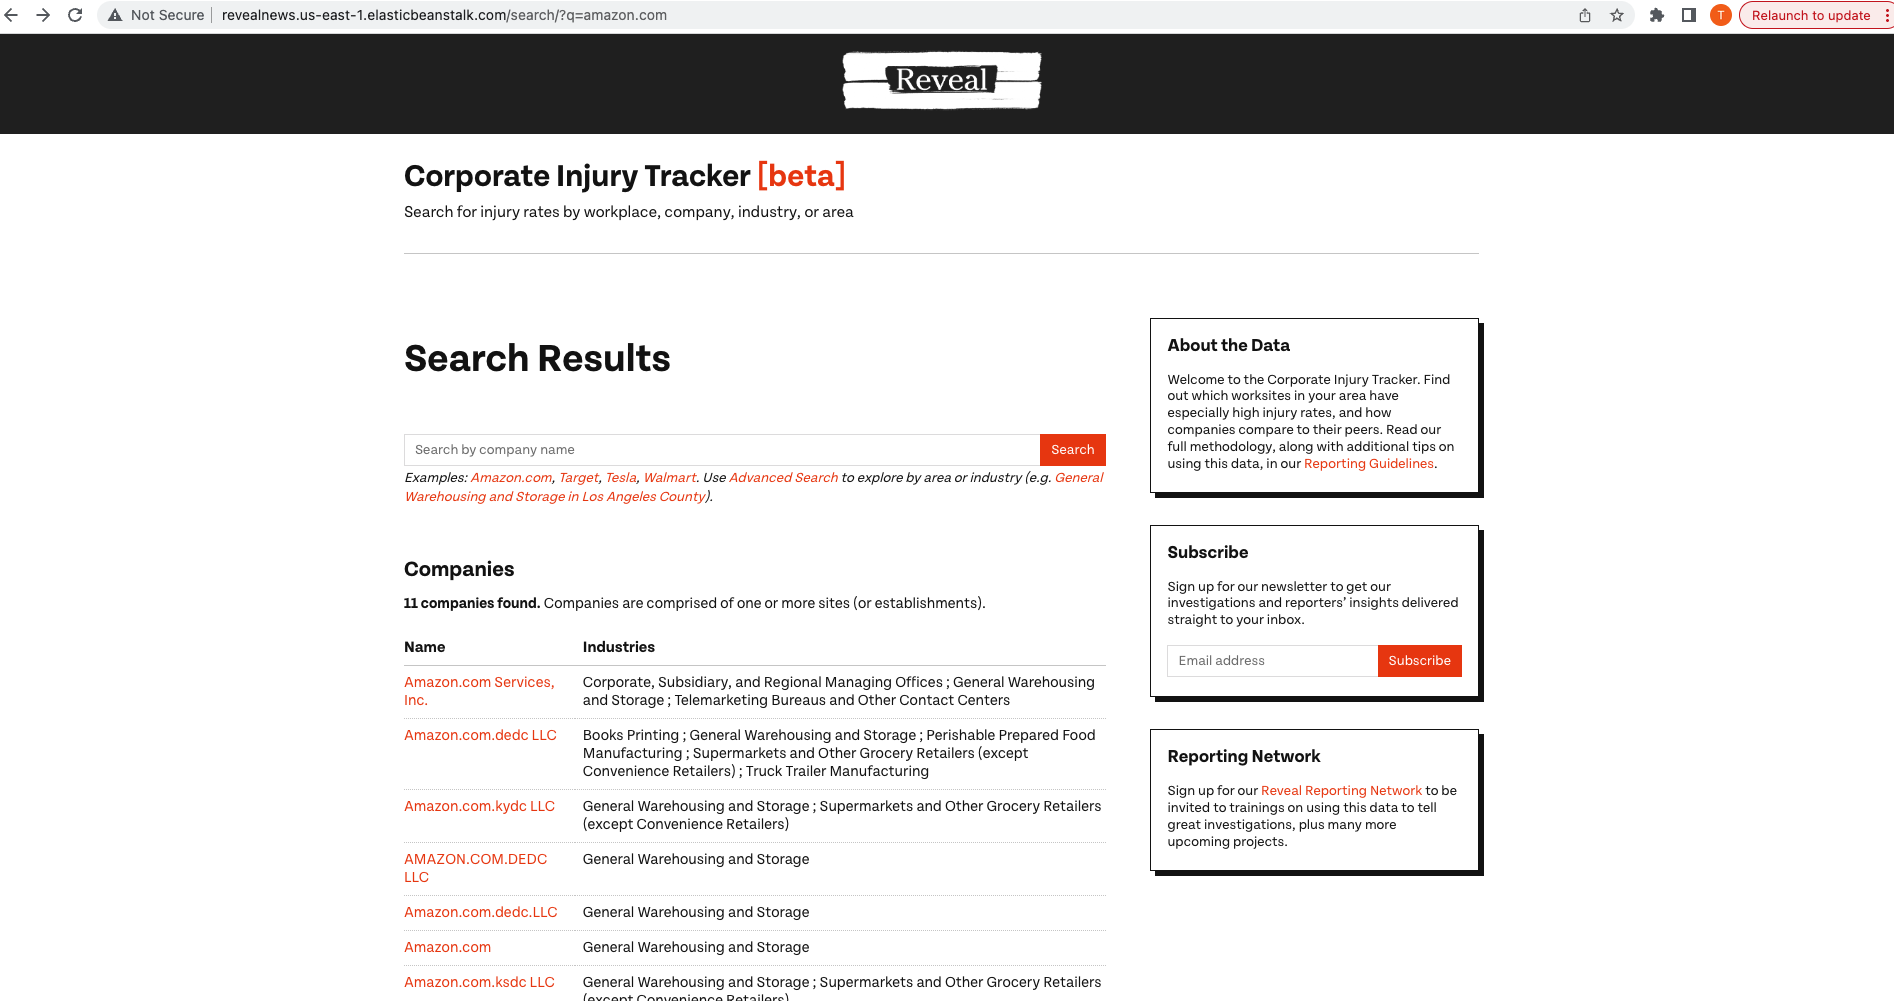
Project Overview
Goal: This endeavor revolves around the creation of a web application designed to compile and present statistics from OSHA’s Injury Tracking Application. OSHA, an acronym for Occupational Safety and Health Administration, involves the collection and reporting of data pertaining to accidents and injuries across various industries and companies on an annual basis.
Problem Statement: We were tasked with developing and deploying a comprehensive web application using Django and Javascript. This involved containerizing the application using Docker and subsequently deploying it on AWS to facilitate the reporting of statistics from OSHA’s Injury Tracking Application. An initial codebase was provided, encompassing fundamental features of the website.
Long-term Goals: Reveal’s injury tracker holds significant importance as it provides public access to Occupational Safety and Health Administration (OSHA) data, which was previously obtained through legal action. The tool enables users to search and filter by company name, location, and industry, effectively visualizing injury rates and comparing them to industry standards, ultimately shedding light on workplace safety and highlighting the impact of injuries that lead to serious consequences.
About RevealNews:
The Center for Investigative Reporting empowers the public through investigative journalism and groundbreaking storytelling in order to spark action, improve lives, and protect our democracy. Our mission is to tell stories that hold the powerful accountable and uncover information that would otherwise remain hidden from the public - revealing injustices, exposing threats to public safety, championing human rights, speaking out against environmental degradation, and shining light on fraud and waste of taxpayer funds.
Proposed Deliverables:
Initially tasked with creating a React-Django multi-page website, our focus shifted upon discovering their existing version of the application. We then concentrated on enhancing code quality via linting and unit testing, while also implementing an efficient, fully-automatic one-click deployment pipeline using AWS, replacing the previous manual Heroku deployment. Additionally, we attempted to streamline data integration to ensure seamless compatibility with the current database structure for future data updates.
Data:
The Occupational Safety and Health Administration (OSHA) provides yearly injury reports for various industries and companies from 2016 to 2022, eliminating need for further data collection. While it does regular data updates, the primary challenge is integrating that data into our application by transforming it to match our data model.
Process:
Code Quality: Enhanced code quality through Pytest for unit testing, Pylint & Flake8 for code formatting, and comprehensive use of docstrings while removing redundant code.
Automated Deployment: Streamlined deployment using GitHub Actions & Dockerization, with AWS ECR for image storage and AWS CodePipeline for automated deployment to Elastic Beanstalk within an ECS-based multi-container docker environment.
Data: Analyzed provided python scripts to understand the transformation process of OSHA data into JSON files within the application code. These JSON files are loaded into the Postgres database within the Docker container during startup.
Challenges:
- Deployment Complexity: As newcomers to Docker and Elastic Beanstalk, a substantial amount of time was invested in configuring the deployment process. Extensive experimentation was necessary, especially for optimizing the production mode setup involving Django, Nginx, and Gunicorn. Valuable assistance was obtained from Nick and Todd to successfully containerize the application.
- Bridging Data Gaps: During the data transformation process, multiple gaps were identified, prompting us to collaborate closely with Melissa from RevealNews. She shared vital additional code that was absent in the original data repository, allowing us to address crucial gaps in the data transformation process.
While substantial progress has been made in closing the data gaps, this aspect remains an ongoing effort requiring further investigation and refinement.
Final Deliverables:
Frontend Approach: While initially considering ReactJS, we found the use case simpler, prompting us to proceed with their existing vanilla JavaScript code and Django template-based method, aligning with the project’s needs.
Final Deliverables: The majority of the project’s deliverables adhered to the original plan. Currently, the deployment process is established on an HTTP server within the DSI AWS account. As Reveal News plans to transition to HTTPS using their own domain, we have furnished comprehensive deployment documentation from our side.
Website: The website is successfully operational at - URL: http://revealnews.us-east-1.elasticbeanstalk.com (Link deployment removed: due to Revealnews operation)
Visuals:
Deployment_Architecture:


Data_Pipeline:

Presentation_to_RevealNews:

Results:
- Led the development and deployment of a Full-Stack web application using Django, ReactJs, Docker, AWS to report
OSHA’s Injury Tracking Application statistics for ”Reveal News” - Center for Investigative Reporting
- Developed a REST API with Django REST, Docker, bridging ReactJS, JavaScript front-end with PostgreSQL
- Streamlined and enhanced deployment processes by utilizing AWS CodePipeline and AWS Elastic Beanstalk, integrating Docker image pushes to AWS ECR, created a fully-automatic one-click deployment, reducing deployment time by 60%
- Authored Python unit testing to ensure code reliability and stability, achieving over 90% test coverage
- Implemented an improved version of the data preprocessing ETL pipeline, reducing runtime by more than 40%, and built a high-quality SQL database for Injury tracking data containing more than 2 million instances
- Developed algorithms utilizing machine learning techniques such as feature engineering and NLP to enhance entity
resolution and geocoding within the OSHA dataset, and improved data accuracy by more than 60%.
- Utilized PCA scatter plots and CDF graphs for data visualization, aiding in critical dataset cutoff decisions
Relevant Links and/or Attachments: